“The first rule of compounding is never to interrupt it unnecessarily.” — Charlie Munger, Vice Chairman, Berkshire Hathaway
In Part 1, I covered three investing lies that quietly derail people who are otherwise doing everything right — the belief that you need to be smart, that beating the market is the goal, and that exciting sectors produce the best returns. Here are two more mistakes I see consistently.
These are tricky because they seem intuitive, and the financial industry actively encourages them.
Misconception #4: You Need to Trade All the Time
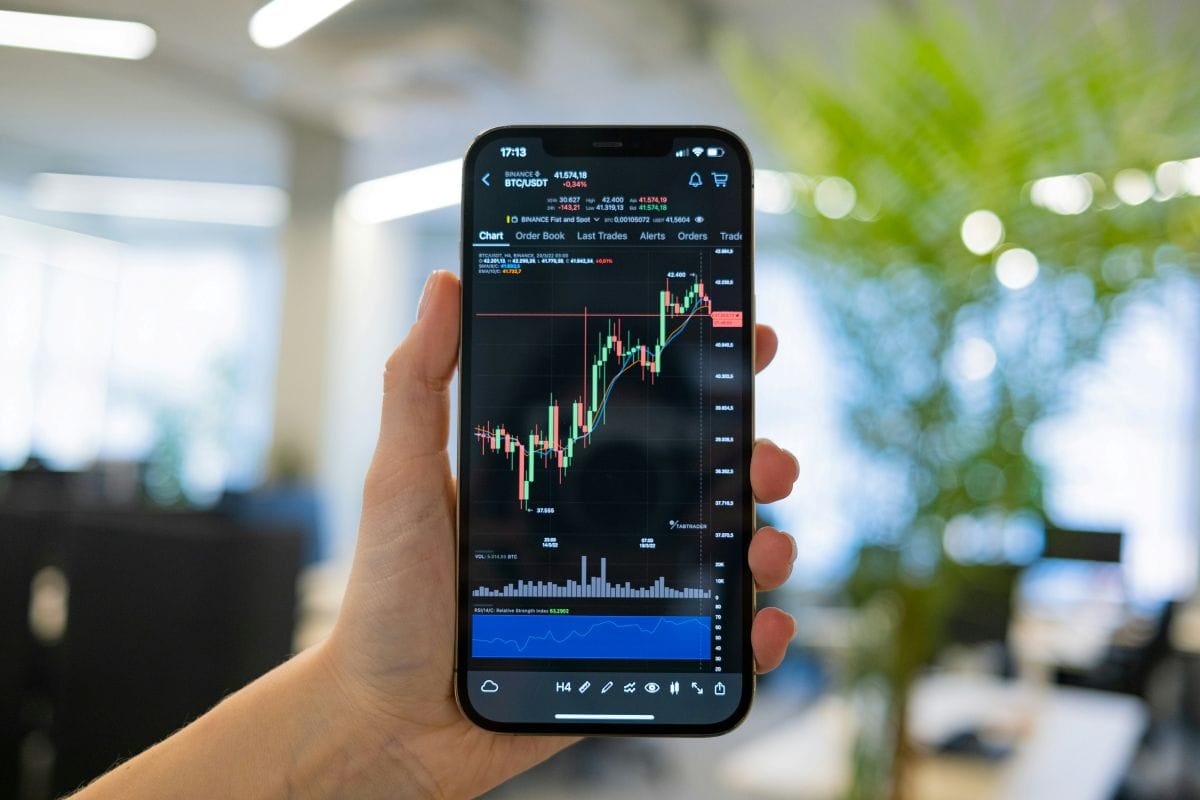
Open any brokerage app and you’ll find the same message: trading is easy, trading is free, and trading is something you should be doing RIGHT NOW, from your phone.
Schwab, Fidelity, and Robinhood have all built beautiful platforms designed to make an active trader *feel* like a better investor. Their ads show confident people sending trades from their phones with a satisfied smile.
Ridiculous.
Here’s what those ads don’t show: the long-term performance data on active traders versus people who bought a diversified portfolio and left it alone. It isn’t close. DALBAR has tracked the gap between what the market returns and what the average investor actually earns for over 30 years. The pattern is consistent: investors sell out during downturns and miss the rebounds. Which is why the difference between the market’s return and that of the average investor has come to be known as “the behavior gap”.
DALBAR QAIB — Annual Returns 2022–2025
The Behavior Gap
What the market returned each year — and what the average equity investor actually earned. In down markets, investors tend to lose more than the index. In up markets, they tend to capture less.
Over four years, the average investor earned 8.33% annually while the S&P 500 returned 12.77% — a gap of 4.44 percentage points every year. In the down year, investors lost more than the index. In the up years, they captured less. The market was not the problem. Behavior was. The one year the gap nearly closed — 2025 — was the year defined by staying the course through volatility, not by chasing opportunity.
Source: DALBAR, Inc., Quantitative Analysis of Investor Behavior (QAIB). 2024 Press Release (April 11, 2024) reporting 2022–2023 data; 2025 Press Release (March 31, 2025) reporting 2024 data; 2026 Press Release (April 16, 2026) reporting 2025 data. dalbar.com. Four-year averages are simple arithmetic means calculated from annual figures reported in DALBAR press releases. Past performance is not a guarantee of future results. Index returns do not reflect the expenses associated with the management of an actual portfolio.
The core problem with frequent trading is that it interrupts the one force that actually builds wealth over time: compounding. Every time you sell, you reset the clock. You may also trigger a taxable event, pay a spread, and — most importantly — risk being out of the market on the days that matter most.
Here’s what a sensible investment process actually looks like: decide on an asset allocation, research low-cost funds that fit it, buy them, and set up automatic contributions. If you hold multiple asset classes — stocks, bonds, real assets — rebalance once or twice a year when the mix drifts. That’s it. That’s the whole process.
I’ve worked with many investors who built real wealth, and none of them did it by trading often. They set a plan and stay in their lane. The ones who check their portfolios daily and trade on instinct almost always underperform the ones who don’t.
Trading every day is profitable — for the online brokerage. For the end investor, it often destroys value.
Misconception #5: You Can Protect Yourself by Avoiding Big Downturns
This one sounds reasonable. If you could step aside before a market crash and get back in before the recovery, you’d come out ahead. The math is obvious.
The problem is that nobody can do it — not consistently, not reliably, not even the professionals who watch markets all day for a living.
Here’s a thought experiment: imagine you actually knew the market was going to crash on a specific date, and you also knew exactly when it would recover. You could sell before the drop, buy before the bounce, and make a killing. Of course you could. But that’s not a strategy — that’s a fantasy. Downturns don’t announce themselves. Neither do recoveries.
What makes market timing especially dangerous isn’t just the difficulty of calling the crash. It’s what you miss when you’re out of the market waiting for your moment.
The biggest single-day gains in stock market history cluster right around the biggest losses. The best days often follow the worst days — sometimes within the same week. An investor who stepped out during the 2008 financial crisis and waited for “things to settle down” missed a significant portion of the recovery that followed. Investors who timed out of the COVID crash in March 2020 and waited for clarity missed one of the fastest recoveries in market history.
If you try to avoid the worst days, you’re almost certain to miss some of the best ones. And missing just a handful of the market’s best days dramatically reduces your long-term return.

There are always reasons to sell. There will always be a news cycle that makes staying invested feel reckless. The discipline to remain invested through volatility — particularly when you have a written plan and a portfolio you understand — is one of the most valuable things a long-term investor can develop.
If you’re properly diversified and have a time horizon measured in years, not months, markets have historically recovered and made new highs. That doesn’t make volatility comfortable. But it does make it survivable — and for patient investors, often profitable.

The Common Thread
Both of these mistakes — over-trading and market timing — share the same underlying belief: doing more produces better results. There are many areas of life where this is true — but when it comes to investing, it simply is not the case. The evidence points overwhelmingly in the opposite direction.
Investing rewards patience, discipline, and a plan you can stick to when things get uncomfortable. It punishes restlessness.
The investors who retire well aren’t the ones who make a brilliant trade no one else saw. They’re the ones who made a sound plan early and didn’t let fear or excitement talk them out of it. A good advisor can be quite helpful when it comes to keeping emotions from overwhelming a financial plan.
Ready to talk through whether your investment approach is set up for the transition ahead?
My first conversation is always free — no pitch, no pressure, just an honest look at where you stand.
Originally published October 28, 2025. Rewritten and expanded April 2026.